XDR Forensics Responder Architecture; overview and performance analysis
What is an XDR Forensics responder?
Section titled “What is an XDR Forensics responder? ”The XDR Forensics Responder is a compact, cross-platform, zero-dependency package that functions as a virtual incident responder, delivering Level 3–4 SOC investigative capability directly to your assets.
Responders interface with the XDR Forensics Console to execute precise, user-defined tasks while consuming minimal system resources. This design enables comprehensive investigative coverage without the overhead of continuous telemetry collection or real-time monitoring, improving both cyber resilience and operational efficiency.
The XDR Forensics responder maintains regular communication with the XDR Forensics Console using HTTP polling, which we commonly refer to as a “visit.”
During each visit, the responder checks in with the XDR Forensics Console to:
- confirm that it is online and available
- retrieve any pending task assignments
- report task status or results
Visit interval
Section titled “Visit interval ”Responders communicate with the XDR Forensics Console at regular intervals. Visit intervals are scaled dynamically for large-scale deployments: the effective interval depends on the organization’s total number of managed assets and whether the console is SaaS or on-premises, using environment-specific defaults, a scaling adjustment above a fixed threshold, and minimum and maximum bounds so polling stays predictable and sustainable. Each responder uses the interval calculated for that combination—no per-asset manual tuning is required as the managed fleet grows or shrinks.
Default visit interval (organizations at or below the scaling threshold use this interval)
- SaaS deployments: 2 minutes
- On-prem deployments: 1 minute
Scaling behavior
When the number of managed assets exceeds 1,000, the visit interval increases from the default according to the formula below. The result is capped so it never falls below the minimum or above the maximum for that environment.
Scaling formula
interval = DEFAULT + (assets - 1000) × 3.33 ms
Where DEFAULT is the base visit interval for the environment:
- 1 minute (on-prem)
- 2 minutes (SaaS)
Bounds
| Environment | Minimum interval | Maximum interval |
|---|---|---|
| On-prem | 1 minute | 10 minutes |
| SaaS | 2 minutes | 20 minutes |
This polling mechanism ensures that responders remain lightweight while still enabling rapid task execution across environments of any scale.
If the responder does not make a visit at the required interval, it will be shown as offline in the XDR Forensics console.
If the responder does not make a visit for 30 days, it will be marked as unreachable. This status will be resolved immediately once the asset is back online.
If the responder does not collect a task assignment within 30 days of its creation, it will expire and will not be actioned even when the asset reconnects and the responder visits next.
How does the XDR Forensics responder work?
Section titled “How does the XDR Forensics responder work? ”Simply put, when the XDR Forensics responder collects a task assignment from the XDR Forensics console, it carries out the task and provides a report back to the XDR Forensics console upon completion. On the other hand, when the XDR Forensics responder is in an idle state, it periodically (as discussed above) sends visit requests to the XDR Forensics console to check if any new tasks have been assigned to it. During these visit requests, the XDR Forensics responder only checks for task assignments and does not perform any other operations.
The XDR Forensics responder is capable of executing various tasks when assigned by the XDR Forensics Console. These tasks include:
- Acquisition
- Hunt/Triage scanning (YARA, Sigma, osquery, MITRE ATT&CK)
- Isolation
- interACT sessions
- Auto Tagging
- Disk/Volume Imaging
- Investigation (Timeline)
- Baseline
- Log Retrieval
- Certificate Authority Update
- Migration
- Reboot
- Shutdown
- Update
- Uninstall
Both the Acquisition and Disk Image tasks support uploading collected evidence to external repositories, including Amazon S3, Azure Blob Storage, Google Cloud Storage, FTPS, SFTP, and SMB. These tasks enable the XDR Forensics responder to securely transfer the acquired evidence or disk images to the designated repositories for storage and further analysis.
By utilizing the supported protocols and repositories, the XDR Forensics responder ensures that the collected evidence or disk images are transmitted and stored securely in the designated locations. This enables efficient storage, accessibility, and collaboration, facilitating the management and analysis of acquired data in a secure and scalable manner.
XDR Forensics has an option for Windows and macOS XDR Forensics responders to transmit evidential collections directly to external evidence repositories, thereby efficiently minimizing the utilization of local disk space:
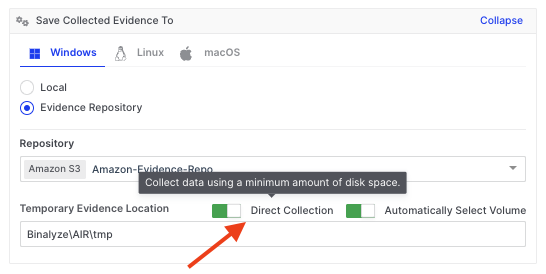
XDR Forensics Responder Architecture; overview and performance analysis: Tool Tip explaining Direct Collection for Evidence Repositories
How is the XDR Forensics responder secured?
Section titled “How is the XDR Forensics responder secured? ”The XDR Forensics responder maintains robust security by implementing a range of measures, including:
Encrypted Traffic: The traffic between the XDR Forensics responder and the XDR Forensics Console, as well as between the XDR Forensics responder and any evidence repositories, is encrypted using TLS 1.2 and, if available on the server, TLS 1.3. If neither of these two TLS protocols is available, the connection will not be established. This ensures that data in transit is protected against interception and unauthorized access.
Communication: The XDR Forensics Console does not initiate the sending of task assignments to the XDR Forensics responder; rather, it is the XDR Forensics responder that initiates the interaction by asking the XDR Forensics Console if it has any tasking assignments ready for it to run. This approach significantly reduces the risk of various security attacks, as it controls the communication flow and reduces the XDR Forensics responder’s exposure to external threats.
Privileged Account Usage: On macOS, the XDR Forensics responder uses the root account, while on Windows, it uses the system account. This level of access control makes it difficult for other users to tamper with the application, thereby enhancing its security.
Regular Internal Penetration Testing: Before every release, our internal penetration testing team conducts thorough penetration testing. This proactive approach helps identify and mitigate potential vulnerabilities.
Secure Libraries and Third-Party Applications: We consistently use updated and vulnerability-free libraries and third-party applications. This precaution in maintaining up-to-date software components protects against known security vulnerabilities.
Supply Chain Attack Prevention: Measures are in place to protect against supply chain attacks, and our DevOps team continuously improves these. This is crucial to prevent threats that could compromise the software development and deployment process.
Continuous Source Code Scanning: The source code is regularly scanned by security tools to identify potential vulnerabilities. This constant monitoring enables the quick identification and resolution of any security issues that arise in the codebase.
Digital Signing: The use of digital signatures adds a layer of security, ensuring the authenticity and integrity of our software. This helps prevent tampering and verifies that the software has not been altered after it was signed.
Blackbox Analysis: The binary undergoes Blackbox analysis, a method of testing the software’s external functioning without delving into its internal structure. This type of analysis has been performed on the XDR Forensics responder. It helps in identifying security vulnerabilities from an outsider’s perspective, providing a critical view of the system’s external defenses.
Graybox Analysis: For the XDR Forensics responder project, Graybox analysis has been conducted. This testing method combines both the internal and external examination of the software, providing a more comprehensive security overview.
Are databases used by the XDR Forensics responder?
Section titled “Are databases used by the XDR Forensics responder? ”Functioning like a server application, the XDR Forensics responder does not use databases. Instead, it operates by saving reports as individual files using SQLite. These reports are subsequently forwarded to the XDR Forensics Console. This approach simplifies the data handling process, enabling the efficient and secure storage and transfer of information.
What is the Cisco XDR Forensics design process?
Section titled “What is the Cisco XDR Forensics design process? ”We continuously advance our development process by implementing the SCRUM methodology, complemented by unit and integration testing. The use of both unit and integration testing is crucial for maintaining high-quality standards and ensuring that each component of our product functions seamlessly individually and as part of the whole system.
Resource monitoring for the XDR Forensics responder
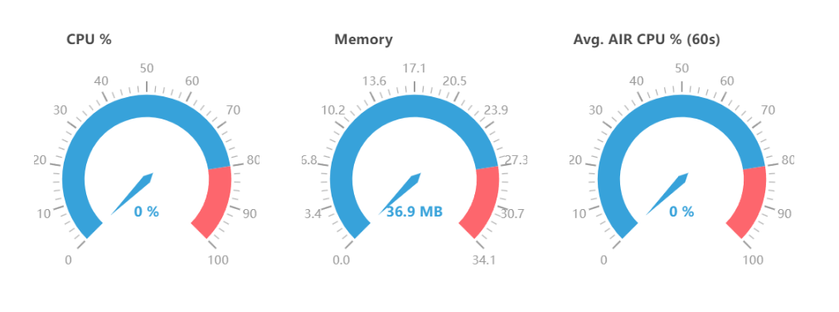
Section titled “Resource monitoring for the XDR Forensics responder ”After the initial installation, it is normal to observe a small amount of memory being allocated, typically around 30MB to 40MB, with no significant CPU or disk usage during idle states. This behavior is expected and can be attributed to the necessary resources required for the XDR Forensics responder to function correctly.
During idle states, the XDR Forensics responder remains in standby mode, pending its next call to the Console to collect any new tasking assignments. The allocated memory is utilized to maintain the XDR Forensics responder’s core functionality and to ensure prompt responsiveness when new tasks are assigned.
When the XDR Forensics responder receives an acquisition task, the evidence collection process is carried out by a subprocess called Tactical (or Incident Response Evidence Collector on Windows). During the acquisition process, it is normal to observe increased CPU and memory usage as the Tactical sub-process actively collects and processes the evidence.
The increase in CPU and memory usage is a result of the intensive data gathering and analysis performed by the Tactical sub-process. It utilizes system resources to capture and process the required evidence efficiently, ensuring the integrity and completeness of the collected data.
The extent of CPU and memory usage during the acquisition task may vary depending on factors such as the size and complexity of the evidence being collected. Once the acquisition is completed, the CPU and memory usage will typically return to normal levels, reflecting the completion of the resource-intensive task.
A Hunt/Triage task does not involve running the Tactical sub-process for evidence collection. Instead, the Hunt/Triage task is executed within the XDR Forensics responder, utilizing its internal capabilities to analyze and evaluate the collected data.
Although the CPU usage for a Hunt/Triage task is typically low, it is still possible to set a CPU policy for the task.
The log file of the running XDR Forensics responder provides valuable information about CPU usage, memory usage, and other system resources. Here is an example of the log entries about system and service resources:
INFO 2024-01-04 18:45:25+03:00 2.31.2 triage: resmon: SysStats{GoHeapAlloc: 2.3 MB, GoHeapSys: 12 MB, NumGoroutines: 27, NumCPU: 16} file:pkg/resmon/handlers.go:16 func:resmon.(*LoggingStatsHandler).HandleSysStatsINFO 2024-01-04 18:45:26+03:00 2.31.2 triage: resmon: PidStats{PID: 9460, Name: AIR.exe, CPU: 14.7%, AvgCPU: 25.9%, Mem: 56 MB, NumFDs: 341, NumCPU: 16} file:pkg/resmon/handlers.go:21 func:resmon.(*LoggingStatsHandler).HandlePidStats
The log file for the XDR Forensics responder can be found at the following location:
C:\Program Files\Cisco\Forensics\AIR\AIR.log.txt
You can navigate this path on your system to access the log file and view the relevant information about CPU usage, memory usage, and other resources as logged by the XDR Forensics responder during its operation.
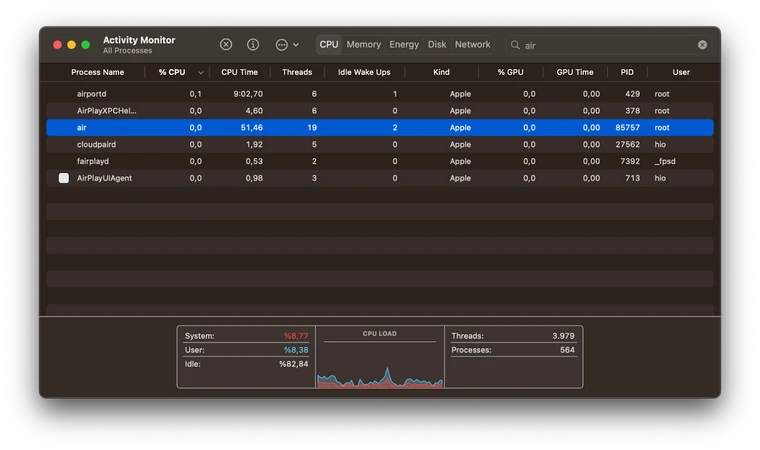
Similar scenarios can be observed on macOS with the built-in Activity Monitor application. To access detailed process information, simply click on the (i) button within the Activity Monitor.
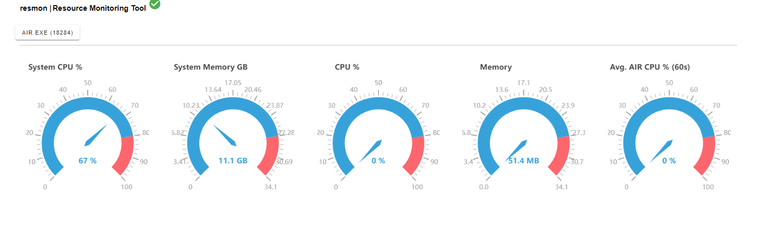
Resource Monitoring with resmon
Section titled “Resource Monitoring with resmon ”There is also a CLI tool named resmon specifically developed for internal usage. It can be used to gather resource usage data related to the XDR Forensics responder and its subprocesses, storing them in a local database.
By default, resmon will monitor the XDR Forensics responder if no flags are given. However, you can monitor other processes by providing a PID flag or a process name flag. For more detailed information on its usage, a usage document for resmon can be provided upon request.
The information collected by resmon is stored in a local database, which includes numerous entries for the monitored process and its subprocesses. Due to the abundance of entries with comprehensive details, reading and interpreting the data can be a challenging task.
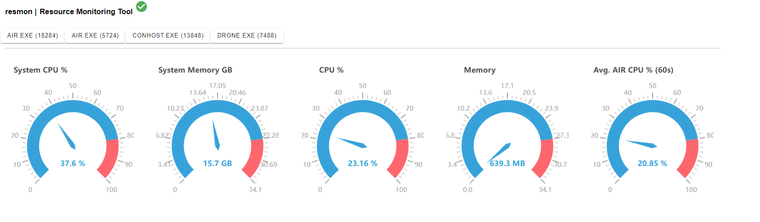
To address this, a script has been developed alongside resmon to visualize these outputs. It displays the CPU and memory usage of the processes (including subprocesses) monitored by resmon in a graphical format.
In the following section, we will share the resmon results as it monitored various task assignments being executed by the XDR Forensics responder. Throughout the tasks, resmon will continuously monitor the XDR Forensics responder and its subprocesses, generating a comprehensive local database that captures the output of resource monitoring.
For easy visualization, we will utilize a feature of a resmon designed to focus on visualizing its output by presenting the CPU and memory usage in intuitive graphical representations. These visualizations offer valuable insights into the resource utilization of the XDR Forensics responder and its subprocesses throughout each tasking assignment, from start to finish.
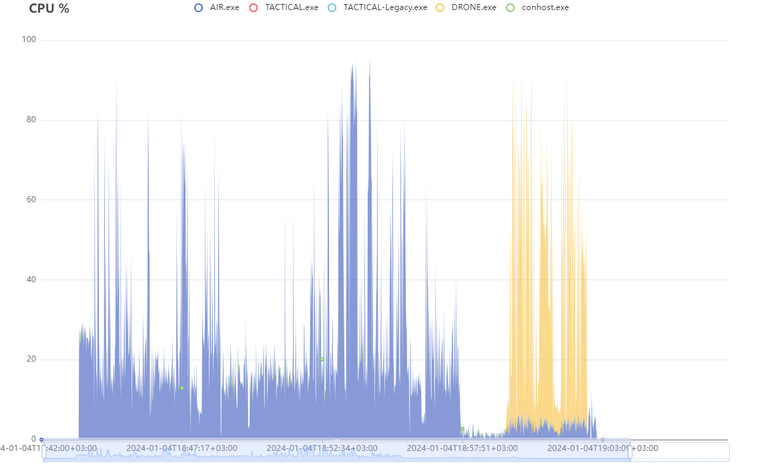
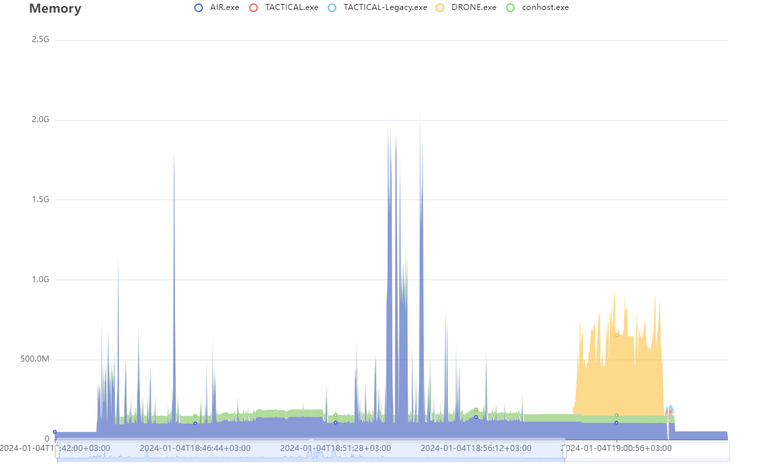
Analysis of an Acquisition Task
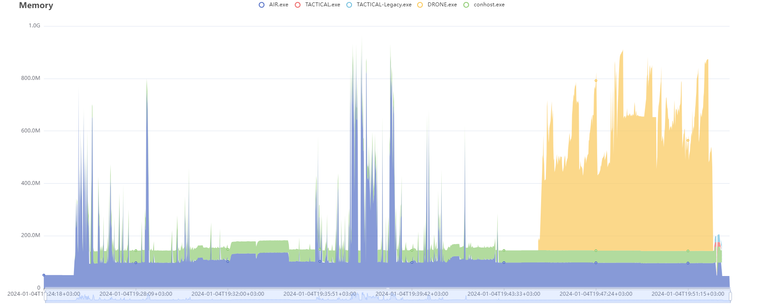
Below, you will find two graphs illustrating the CPU and Memory usage of the XDR Forensics responder. These graphs represent the resource utilization from the moment an acquisition task is started through to its completion.
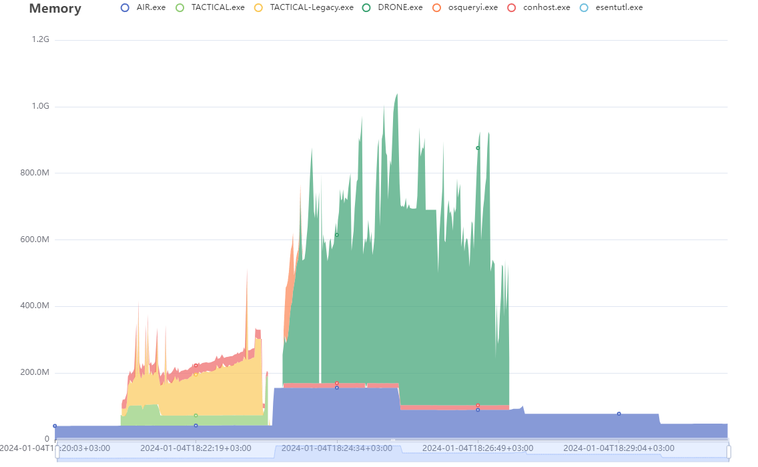
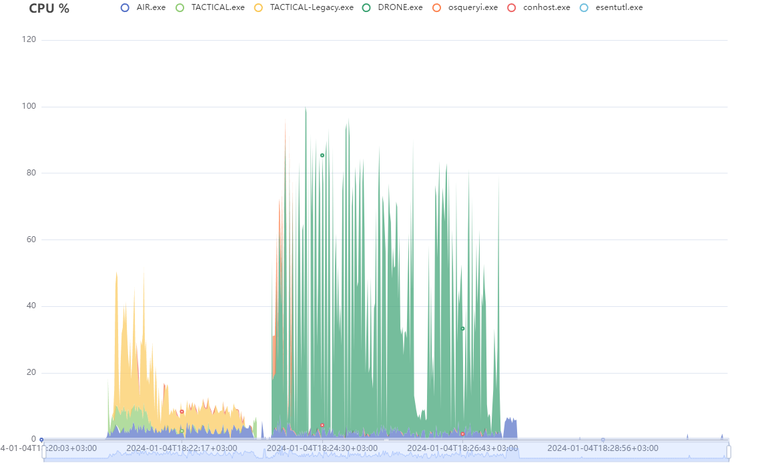
| Duration | Report Size (Zipped) | Database Size | Event Record Count | Drone | Total Disk Space | Used Disk Space | Report Path |
|---|---|---|---|---|---|---|---|
| 06m29s | 199KB | 38KB | 10091 | Enabled | 512 GB | 176 GB | |
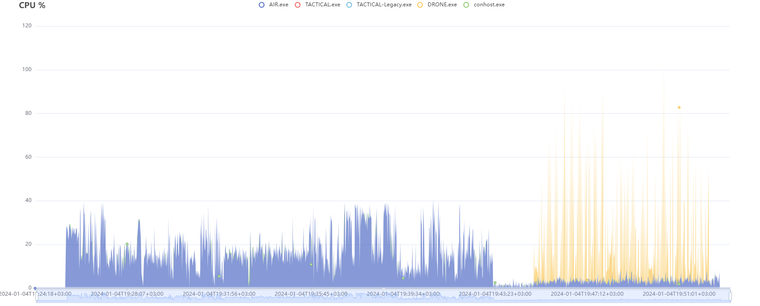
Analysis of an Acquisition Task (with CPU limit of 50%)
In this scenario, we will examine the CPU and Memory usage of the XDR Forensics responder while running tasks received from the XDR Forensics Console, with a specific condition: the CPU usage of the XDR Forensics responder is limited to 50%.
The visualized graphs provided below depict the resource utilization, explicitly focusing on the CPU and Memory usage of the XDR Forensics responder. These graphs illustrate the performance of the XDR Forensics responder, highlighting its ability to effectively manage CPU allocation while executing tasks received from the XDR Forensics Console.
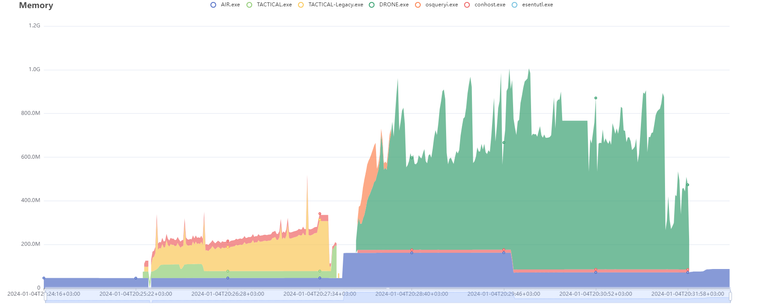
| Duration | Report Size (Zipped) | Database Size | Event Record Count | Drone | Total Disk Space | Used Disk Space | Report Path |
|---|---|---|---|---|---|---|---|
| 06m48s | 200KB | 39KB | 10102 | Enabled | 512 GB | 176 GB | |
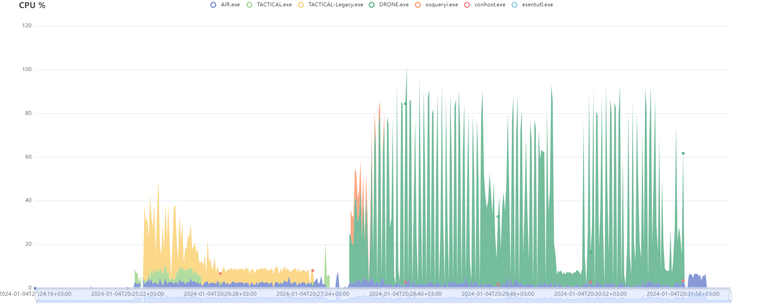
Analysis of a Hunt/Triage Task
Let’s examine the resource usage of the XDR Forensics responder when a Hunt/Triage task is received from the XDR Forensics Console.
| Duration | Hunt/Triage Rule Type | Total Disk Space | Used Disk Space | CPU Limit |
|---|---|---|---|---|
| 19m33s | YARA | 512 GB | 176 GB | 100% |
Analysis of a Hunt/Triage Task (with CPU limit of 50%)
Similar to an acquisition task, a Hunt/Triage task can also be configured with a CPU limit for executing the XDR Forensics responder. The following graphs illustrate the resource usage of a Hunt/Triage task running with a CPU limit of 50%.
| Duration | Hunt/Triage Rule Type | Total Disk Space | Used Disk Space | CPU Limit |
|---|---|---|---|---|
| 27m09s | YARA | 512 GB | 176 GB | 50% |